Monday, February 20, 2012

Moving average and Trend line strategy

This is very effective system it will suitable for all financial markets including Forex

Requirements:
MA 14 (Simple+ Close) default setting
Zigzag indicator from Meta trader
Trend Line

The system is suitable for small TF (15 TF is the best)

Steps:
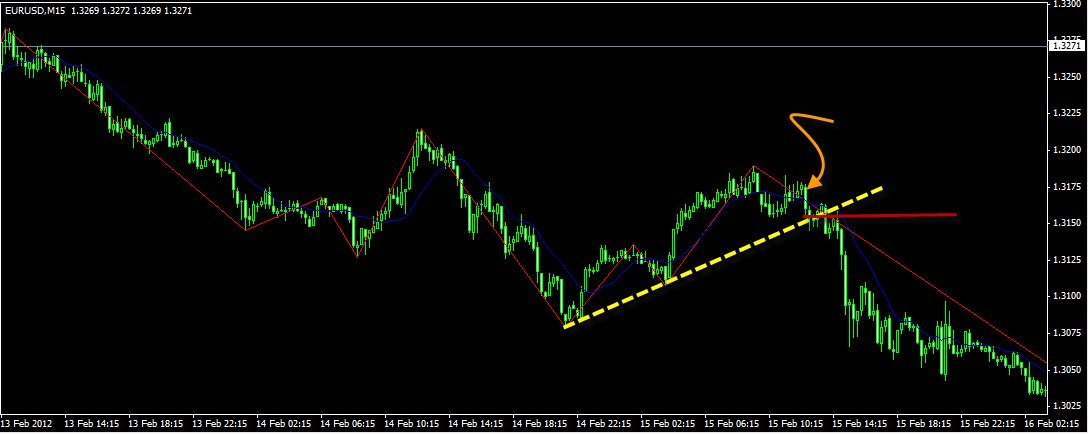
1) Zigzag indicator (default setting) = Red


2) Moving average 14 (Simple MA , Close) = Blue


3) Trend line based on two tops or bottoms = Yellow


Entry place : after Broke the trend line (it is better to waiting till retesting before entering)


Stop lose : above the candle which was crossed (penetrated ) by MA14 (See above chart)
Take profits:
TP 1: at the last support (bottom) in case of short position or
at the last resistance (top) in case of long position
TP2: Double Stop lose(if the distance between the Entry place and stop lose was 50 pips , our second take profits must be 100 pips)


The best pairs: any pairs include EUR+JPY Like( EUR USD, EUR JPY, GBP JPY, USD JPY, CHF JPY, GBP EUR .....etc).

Good Luck

Saturday, February 4, 2012

Secret Doji Method

Introduction:
This is a very simple strategy, yet one of the most reliable setup iَ ve ever seen.
now i am going to share this powerful trading system, i am sure a lot of people out there are eager to arrive to the place i am in now.

as we know Japanese candlestic charts are the best type of other MT4 charts.
but unfortunately new traders give it top priorty in the trading.

at the first :
letَs to see Doji candle shape:


Typical examples of Doji candlestick:


the first condition of the system is : identify 2 Doji one after one as you see in the following chart:


Second condition:
marked the upper and lower borders of those two Doji as you see in the following chart:


The Third condition :
place 2 pending orders , One in case market breaks the upper border of the Doji (One pip is enough) and One in case of breaks the lowerborder of the Doji


Stop Loss:
above the Doji upper border in case of short (sell)
below the Doji lower border in case of long (buy)


Take profits:

there are tow methods:
1) TP is equal of SL (70% winning trades)
2) The best method : Enter with to lot , set your first TP as equal SL, and the second TP double SL.


The best Currency pairs:
the ones that involve the USD
all YEN crosses (EUR JPY, GBP JPY, AUD JPY  etc).

Good Luck

Saturday, January 28, 2012

Powerfull Strategy (Trade with the Trend)

Steps:
Draw Daily trends:


Down trend , so we will enter Sell Only.

Then open 4H TF:
Draw Fibo level:


wait till Reversal candlestick forming (Hammer+ Inverted hammer +Doji+ Shooting Star) Only:


Then enter at the next candle(Sell) , and set your SL above High of the Reversal candlestick +5 pips :


How to set your TP:

Enter Sell with 2 lot, you must closed your first lot (double SL)
Your second TP : using Fibo Expansion at (FE 50 ) as you see in the following:

Good Luck
Good Luck

Trade with Fibo Levels Only

Strategy based on Fibo levels Only (0 , 38, 50, and 76).
Time frame: 4h and daily Only.
Pairs: all
How to trade:


1) draw fibo level from High to Low (the last high pre- Broked trend, and the first Low after Broked trend).
2) Enter sell from : 38 and 50 and 61
3) SL: 76 Fibo level.
4) TP: 0 Fibo level.
Very important :
Broked zone Must be above the 38 fibo level(Broked zone= Blue horizontal line).
Good Luck

Saturday, January 21, 2012

500 pips Daily using BB only

Time frame: 1 H
Pairs: all
Indicators: Bollinger band ONLY.

Steps:
open the chart ( 1 h frame).
Place a vertical line at zero Candle.
modify settings of Bollinger from 2 to 1.5 and placing them in the chart.
Place horizontal lines starting from the intersection of the upper Bollinger line with a candle zero.
place horizontal lines starting from the intersection of the lower Bollinger line with a candle zero.


HOW TO TRADING:
entry BUY if:

1- Price broke through the line of the Bollinger lower down and closed above
(Opening the bottom line and closure the top of the line).
2- Penetrate the upper line from the bottom of the Bollinger horizontal line to the above.

entry SELL: (Vice versa).

TAKE PROFITS:
1 - in the first case :
The upper line of Bollinger in the case of BUY and the bottom line of Bollinger in the case of SEEL.
2- In the second case 20 pips only.

STOP LOSSES:

Half the value of Take Profit.


Chart:


Two Chances:
1) Buy >>>> Enter with -
2) Buy >>>> Enter with +


Good Luck

Wednesday, January 18, 2012

Sunday, January 15, 2012

The chart of The day, USD INDEX, 15/1/2012

Hello members,
This is my chart


depending on Elliott Analysis

Regards.

Saturday, January 14, 2012

Broken Trend with Fibo Levels

strategy based on Fibo levels Only (0 , 38, 50, and 76).
Time frame: 4h and daily Only.
Pairs: all
see the following chart:


Expanation:
1) we need Broken trend line firstly.
2) draw fibo level from High to Low (the last high pre- Broked trend, and the first Low after Broked trend).
3) Enter sell from : 38 and 50 and 61
4) SL: 76 Fibo level.
5) TP: 0 Fibo level.
Very important :
Broked zone Must be above the 38 fibo level(Broked zone= Blue horizontal line).


Sudanfx
Good Luck


Candlestick Strategy

This strategy depend on candlestick pattern and shape ( for swing trading ).
I want to tell you how you trade (as swing trading) with the trend .
this system is very profitable system..
My test On 1 Pair EUR USD:
From 27/10/2010 till 10/02/2011
Only 8 chances:
2 loses(-506)
7 wins(+1168).

See the following chart :


 4 Chances:

1 lose(-212 pips)
3 wins(+612pips).


if you see the the following chart you will find three Candles..
I will Named it with :-
1,2 and 3
Rules:
First :
Sell Orders:
candle(1) : have lower low than candle(2) and (3).
candle(2) : have Higher High than others.
candle(3):
High: lower than (2)High, Low :Higher than (1) Low.


Vice versa in Buy Orders.